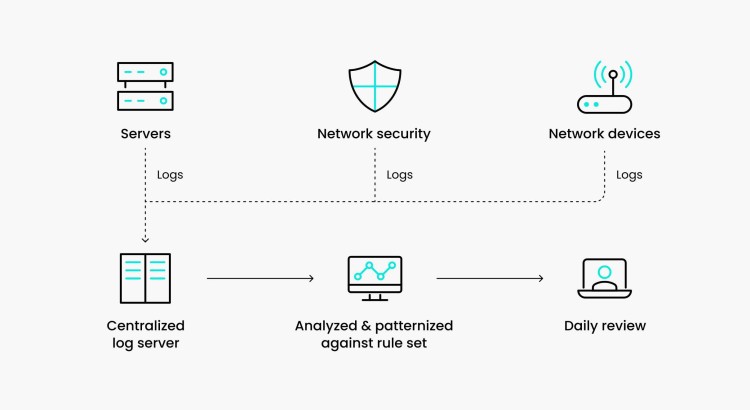
I will implement a monitoring and logging solution (Prometheus/Grafana or ELK stack)

About this Service
Achieve True Observability: Stay Ahead of Issues, Not Behind Them
In modern systems, a lack of visibility can turn minor issues into major incidents, hurting user trust and business reputation.
I offer a comprehensive monitoring and logging setup, providing real-time insights into your infrastructure, applications, and user experiences.
Catch anomalies early, react faster, and build a culture of operational excellence.
Project Phases
Discovery & Planning
- We begin with a requirements workshop: identifying critical metrics, log sources, alert thresholds, and key business SLAs.
Deployment & Configuration
- Depending on your stack, I will deploy and configure either:
- Prometheus + Grafana (metrics-focused environments)
- ELK Stack (Elasticsearch, Logstash, Kibana) (log-centric environments)
Setup includes exporters, agents (Beats/Filebeat), Alertmanager or equivalent systems, fully aligned with best practices.
Dashboards & Alerting
- I will create actionable Grafana dashboards and/or Kibana visualizations, plus configure alert rules with Slack, Email, or preferred channels — minimizing noise and maximizing signal.
Knowledge Transfer
- Delivery of full onboarding documentation, runbooks for incident response, and training sessions if required.
Stack & Tools
- Prometheus + Grafana
- ELK Stack (ElasticSearch, Logstash, Kibana)
- Beats (Filebeat, Metricbeat)
- Alertmanager
- Linux CLI · Git · Slack Integrations
Why Choose Me?
Over the past 5 years, I’ve delivered observability solutions for fintech, SaaS, and e-commerce companies — improving their mean-time-to-detection (MTTD) by over 80% and drastically reducing downtime.
I blend technical implementation with a strong focus on real-world usability: no complex systems that your team can't maintain.
Post-Delivery Support
I include 3 days of post-deployment tuning and advisory support to fine-tune alert thresholds, dashboard filters, or handle new log sources after initial deployment.
Service Features
- ● Fully deployed and configured monitoring & logging stack
- ● Custom-built dashboards tailored to your KPIs
- ● Smart alerting rules tuned to your business impact
- ● A clear, practical onboarding guide for extending metrics/logs
About the Seller
From
Spain
Member Since
Oct 2024
Skills:
Basic
Related Services

DevOps
Newbie Freelancer
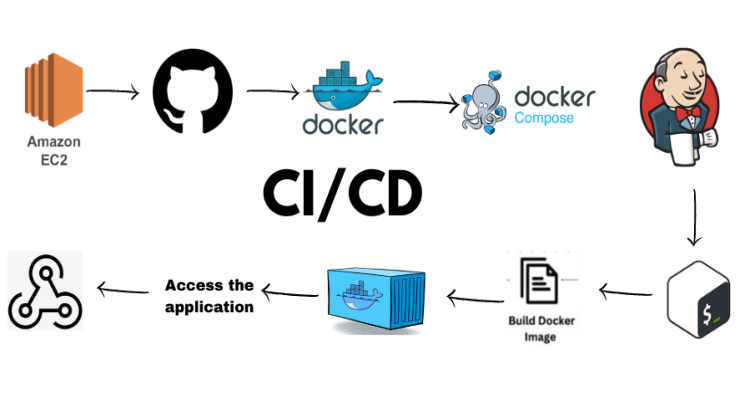
Rapid CI/CD & Docker issue resolution to minimize downtime.
DevOps
Newbie Freelancer
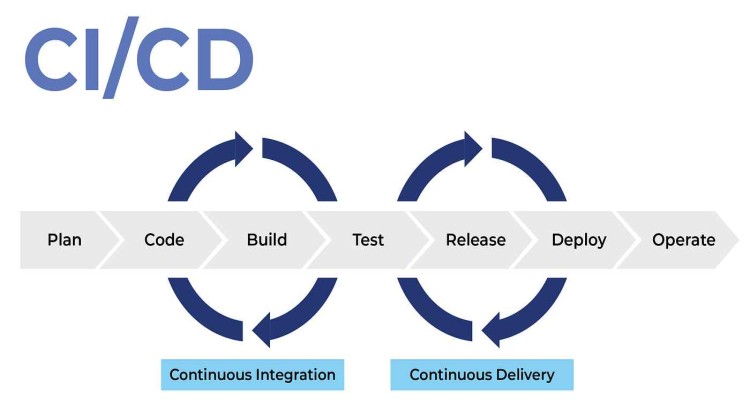
CI/CD setup to automate and streamline your software build, test, and deployment process.

DevOps
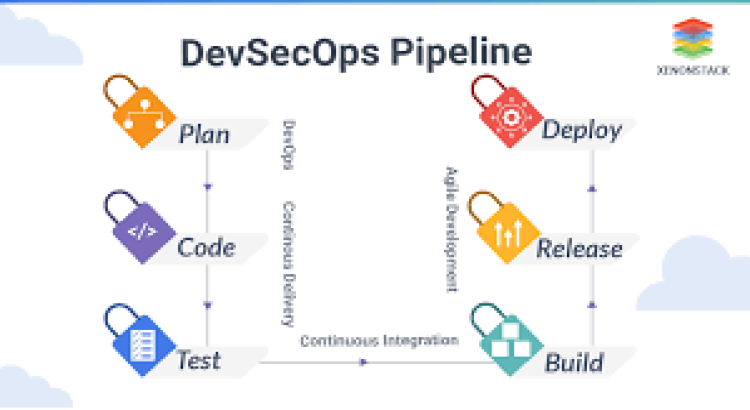
Integrate security into your CI/CD pipeline for secure, automated code deployment.
DevOps
Newbie Freelancer


Join as a freelancer or client
Join as a Freelancer
Join as a Client