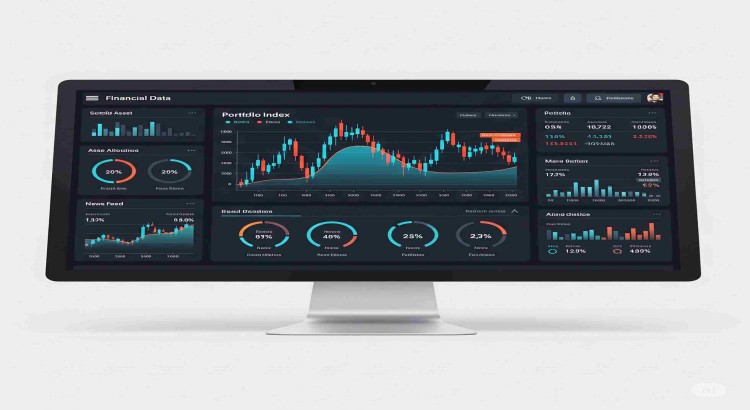
Financial Data Dashboard

About this Service
Are your financial spreadsheets too complex to understand at a glance? I will help you by transforming your raw financial data into a dynamic and easy-to-read dashboard. This service is designed to make financial analysis more accessible, allowing you to quickly spot trends, track spending, and make data-driven decisions without a financial background. My process includes connecting to your data source, structuring it for optimal visualization, and building interactive charts that bring your numbers to life.
Why Choose Me:
As a junior freelancer, I offer a focused and enthusiastic approach to your project. I am highly motivated to build a strong portfolio and deliver a top-quality product that exceeds your expectations. You'll benefit from a more affordable price, and my dedication ensures I will give your project the full attention it deserves. I'm flexible and eager to work with you to ensure the final dashboard perfectly meets your needs.
Service Features
- ● Connection to a single spreadsheet data source
- ● Creation of 3 basic charts
- ● Static PDF report export
- ● Connection to up to 3 data sources
- ● Creation of 5 detailed visualizations and key performance indicators (KPIs)
- ● Interactive dashboard file
- ● Connection to up to 5 data sources
- ● Creation of a comprehensive dashboard with advanced filters, slicers, and trend analysis
- ● A 15-minute consultation to walk you through the dashboard's functionality and insights
About the Seller
Compare packages
| Package |
$450.00
Basic
|
$700.00
Standard
|
$700.00
Premium
|
|---|---|---|---|
| Revisions | 1 | 2 | 3 |
| Delivery Time | Less than a week | 3 Days | 3 Days |
| Connection to a single spreadsheet data source | |||
| Creation of 3 basic charts | |||
| Static PDF report export | |||
| Connection to up to 3 data sources | |||
| Creation of 5 detailed visualizations and key performance indicators (KPIs) | |||
| Interactive dashboard file | |||
| Connection to up to 5 data sources | |||
| Creation of a comprehensive dashboard with advanced filters, slicers, and trend analysis | |||
| A 15-minute consultation to walk you through the dashboard's functionality and insights | |||
| Total | $450.00 | $700.00 | $700.00 |
Basic
Related Services

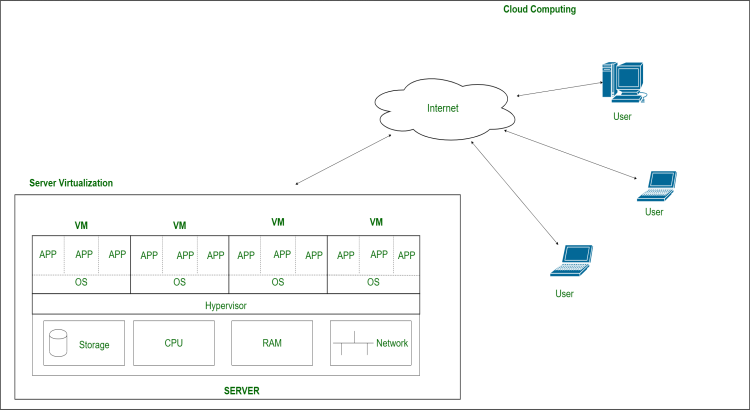
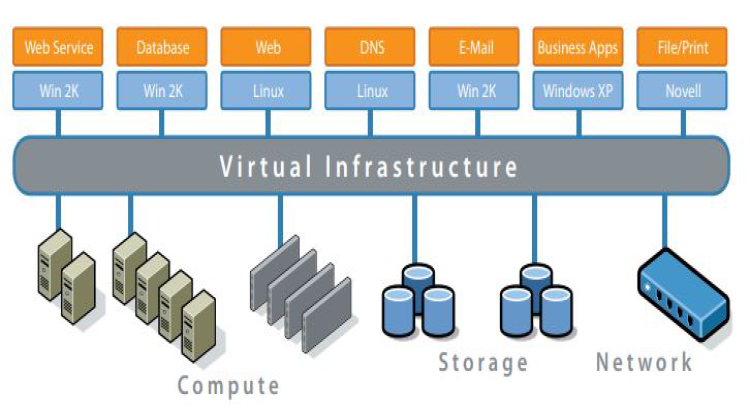
Virtualization
Virtualized server setup and management to reduce costs and enhance flexibility.


Virtualization
Professional setup and configuration of Proxmox VE for efficient server virtualization.


Join as a freelancer or client
Join as a Freelancer
Join as a Client